Dashboards with Streamlit and Evidence
As a part of my freelance work at a marketing agency HappyAds, I created a series of dashboards to help teams access their data in a fast and convenient manner. I want to share two examples from different frameworks in order to demonstrate my technical versatility and dashboarding experience.
The data displayed is random!
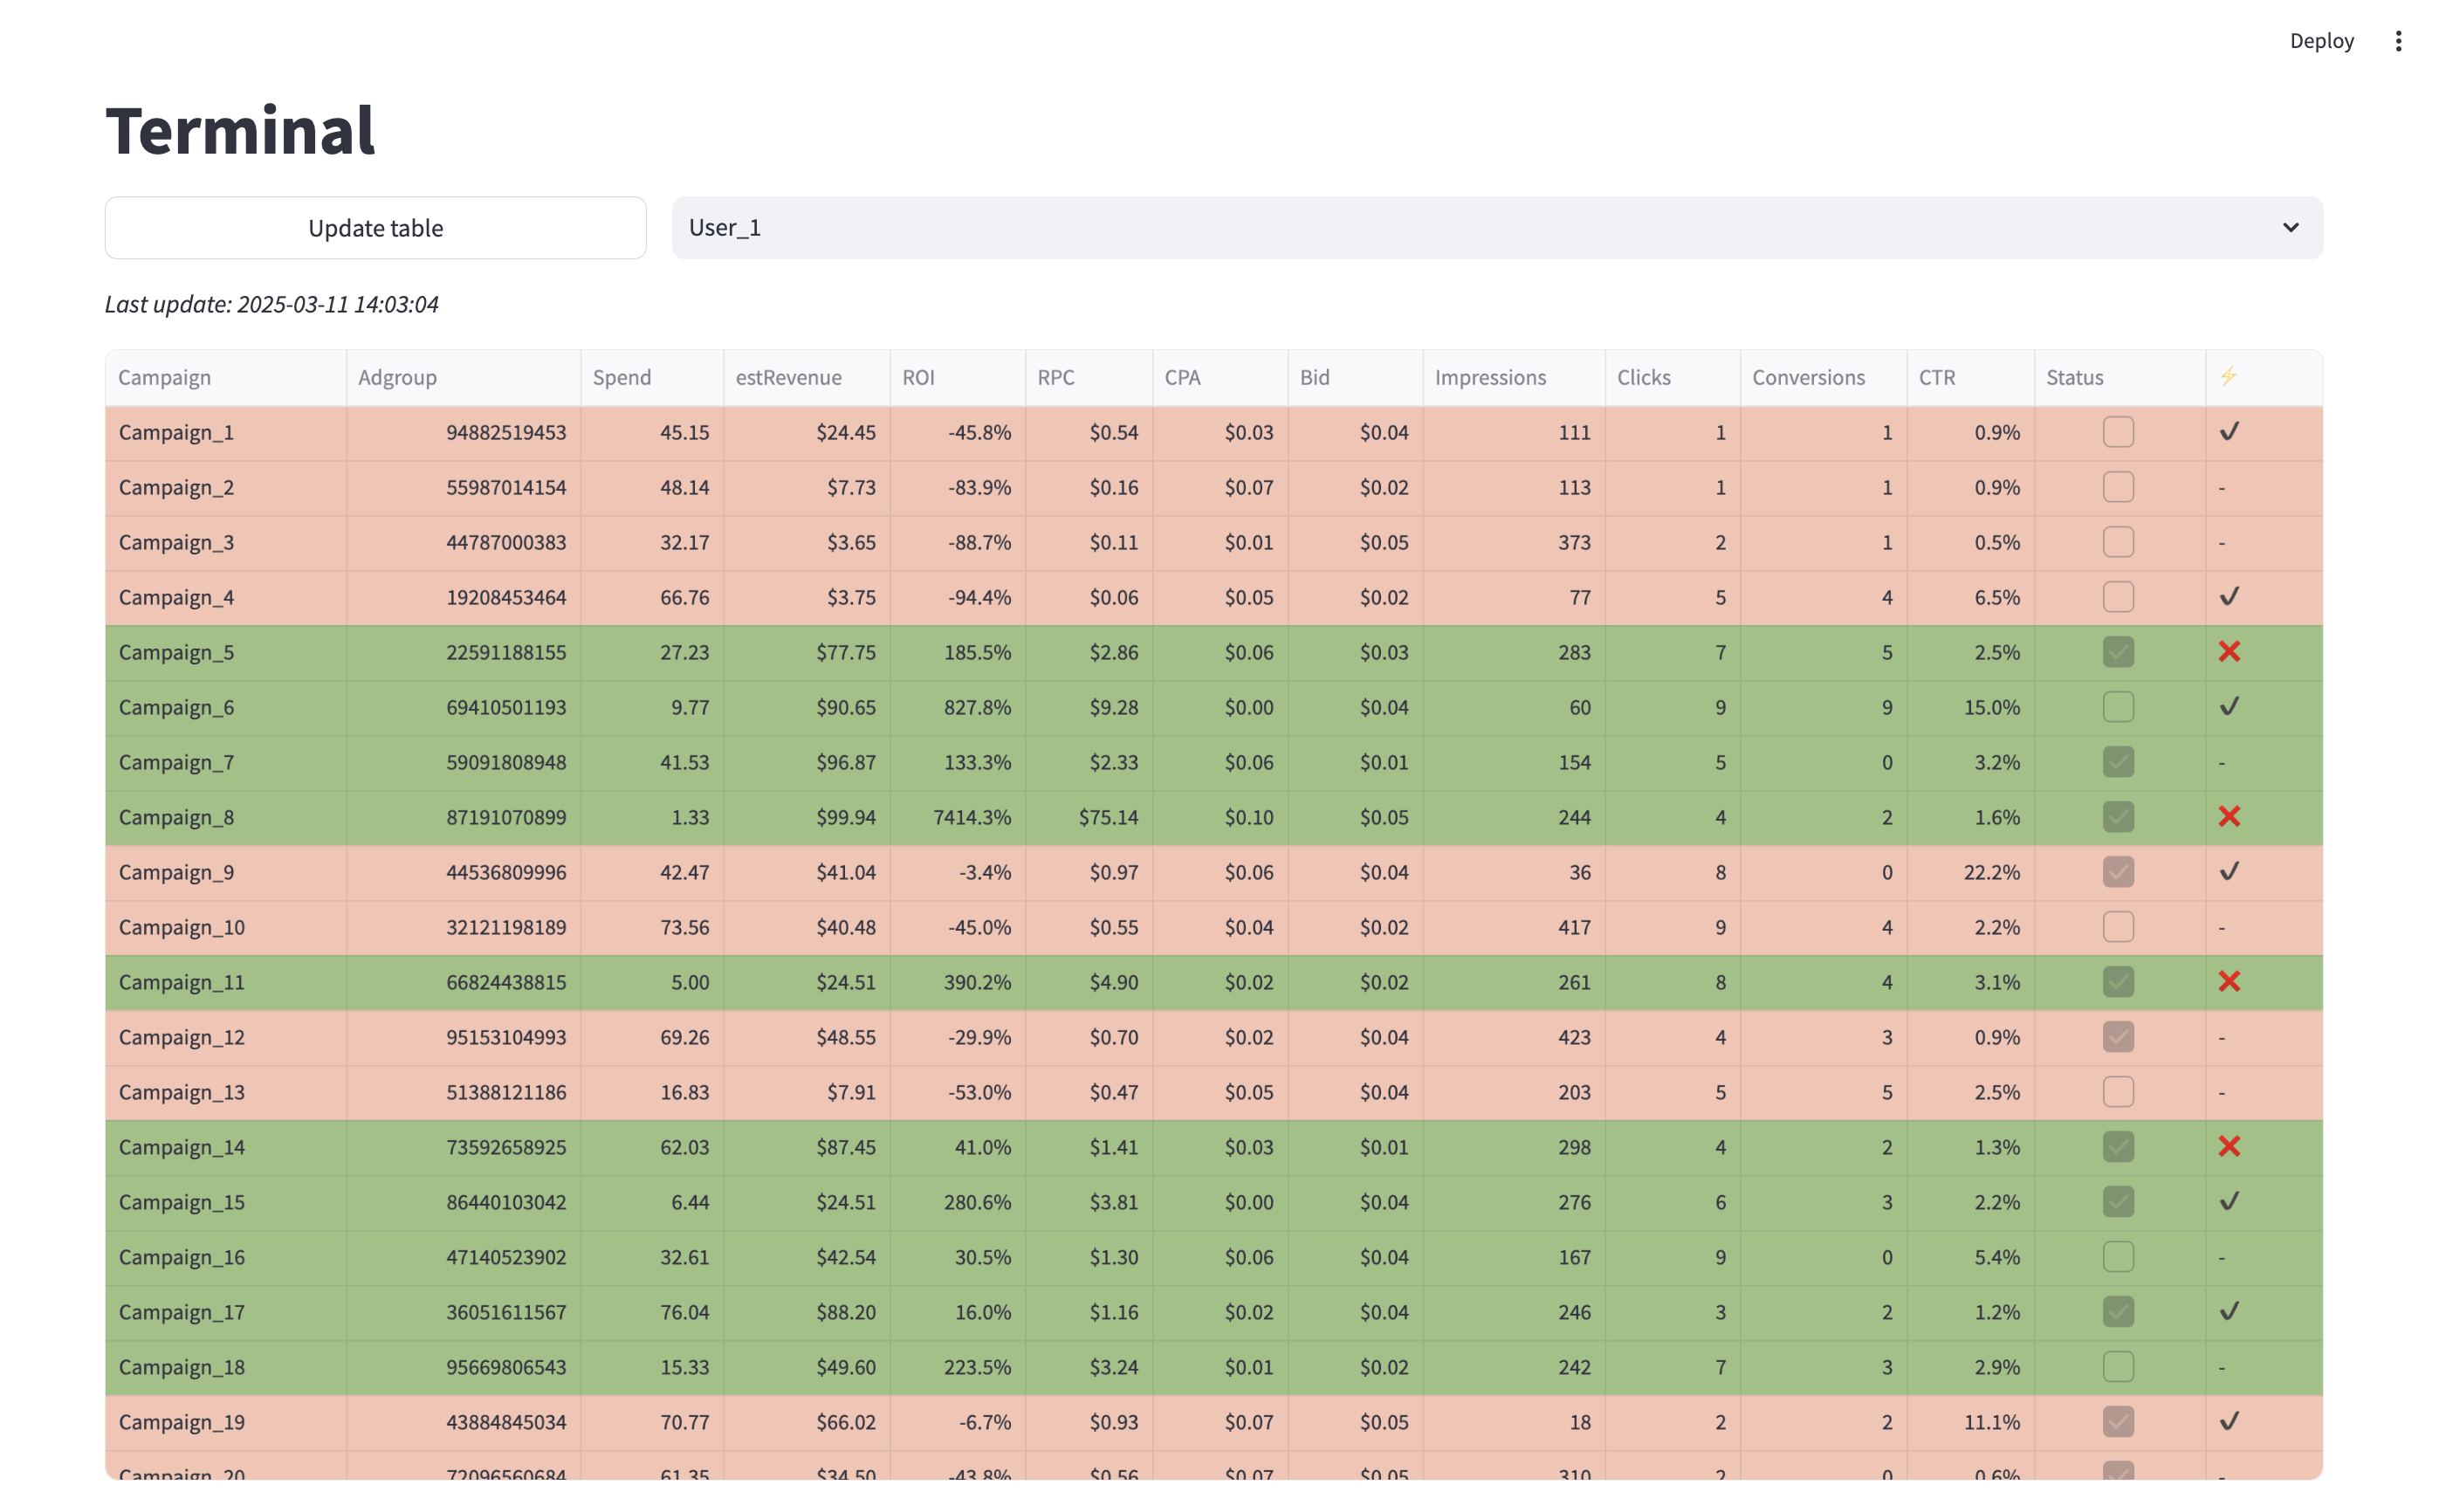
The dashboard below was created using Python and the Streamlit open-source framework. Data is pulled from multiple sources, including the TikTok API and TONIC API, and is subsequently cleaned and transformed to fit the required format. The last column represents advice of whether to continue with a campaign or not based on the results of a machine learning model.
The dashboard is meant to display most relevant and recent data, improving reaction time of the buyer team. Therefore, it includes an ‘Update dashboard’ button that buyers can use to fetch new data outside of a predefined schedule.
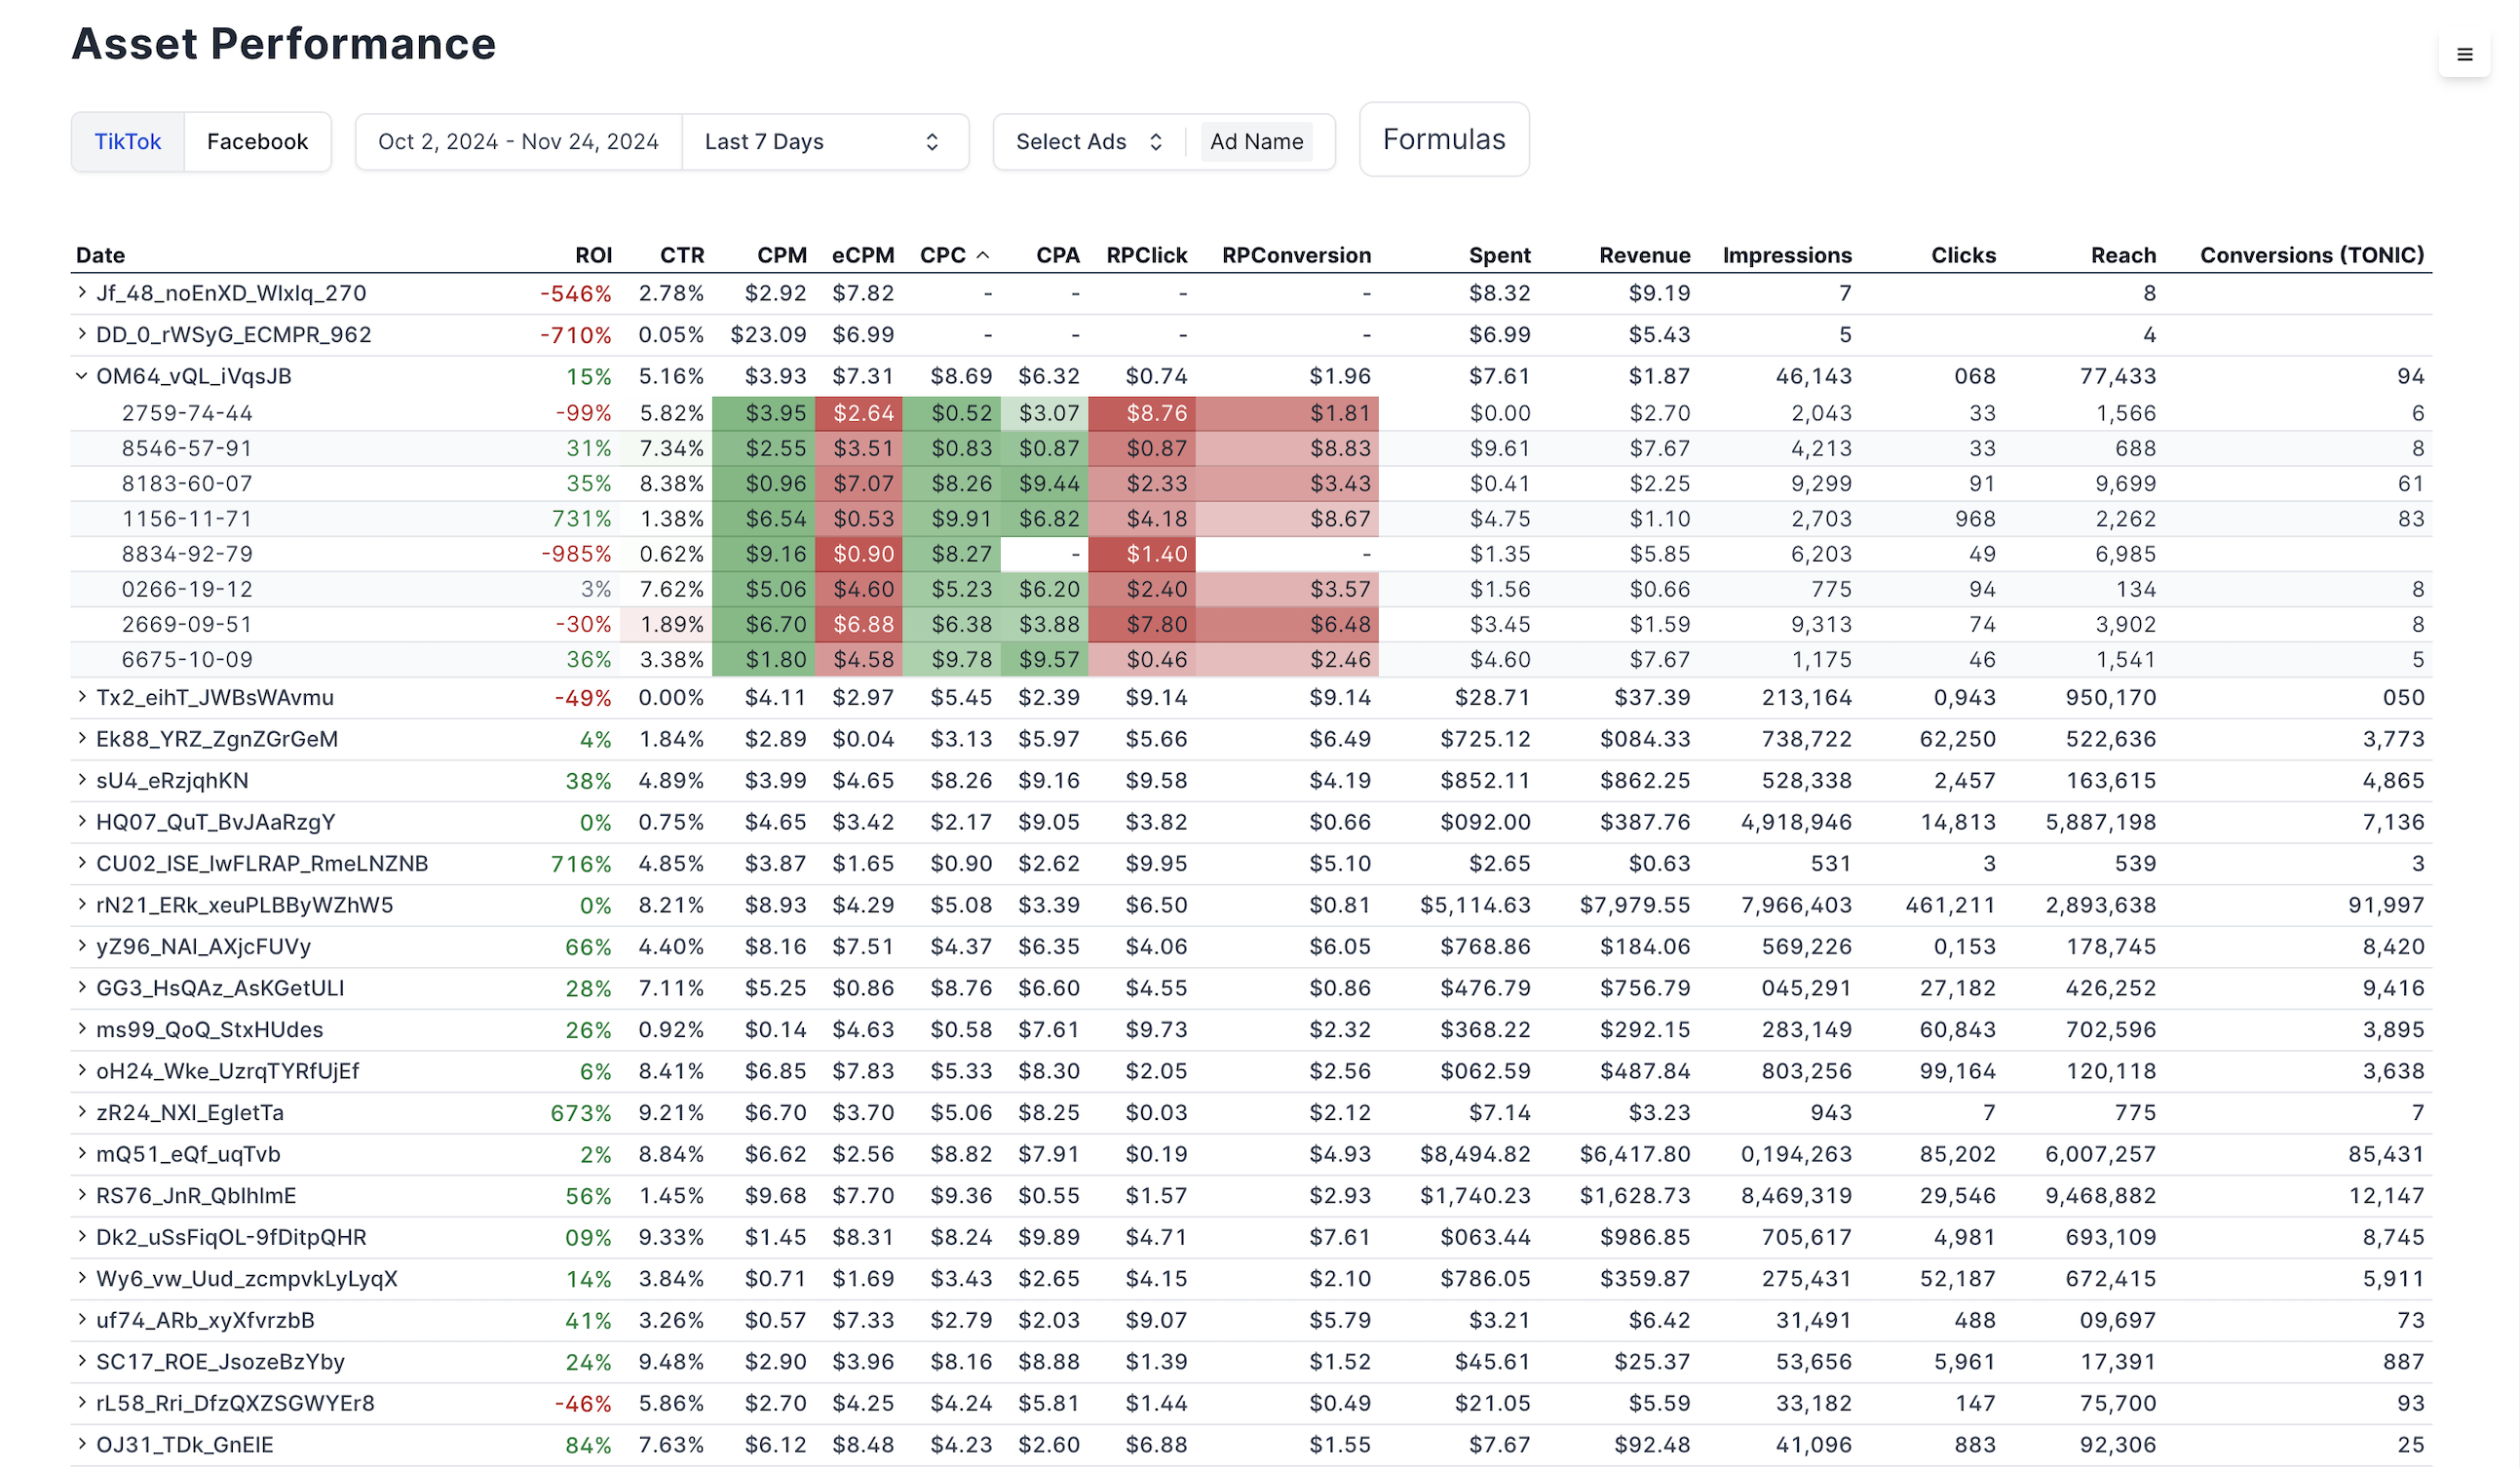
The dashboard below was created using Evidence’s native scripting language and displays the performance of marketing assets. Data is fetched using ClickFlare API as well as with Selenium from theoptimizer.io. It is afterwards cleaned and queried using DuckDB dialect of SQL.
The dashboard is designed to reduce the time needed to analyze creative assets while conveniently displaying their performance over various periods.